Features
Everything you need for location intelligence in the Netherlands. Draw a zone, get demographics, map competitors, and download professional reports — all in one platform.
Overview
Zonera is a self-service location analysis platform designed for commercial real estate brokers, franchisors, retailers, and location consultants in the Netherlands. Instead of paying thousands of euros for consultant reports or spending hours on government statistics websites, you get instant demographic and competitive insights for any location.
The core workflow is simple: enter an address, draw a zone, see demographics, download a report. No training needed, no complex setup — just actionable location intelligence at your fingertips.
Zone Drawing
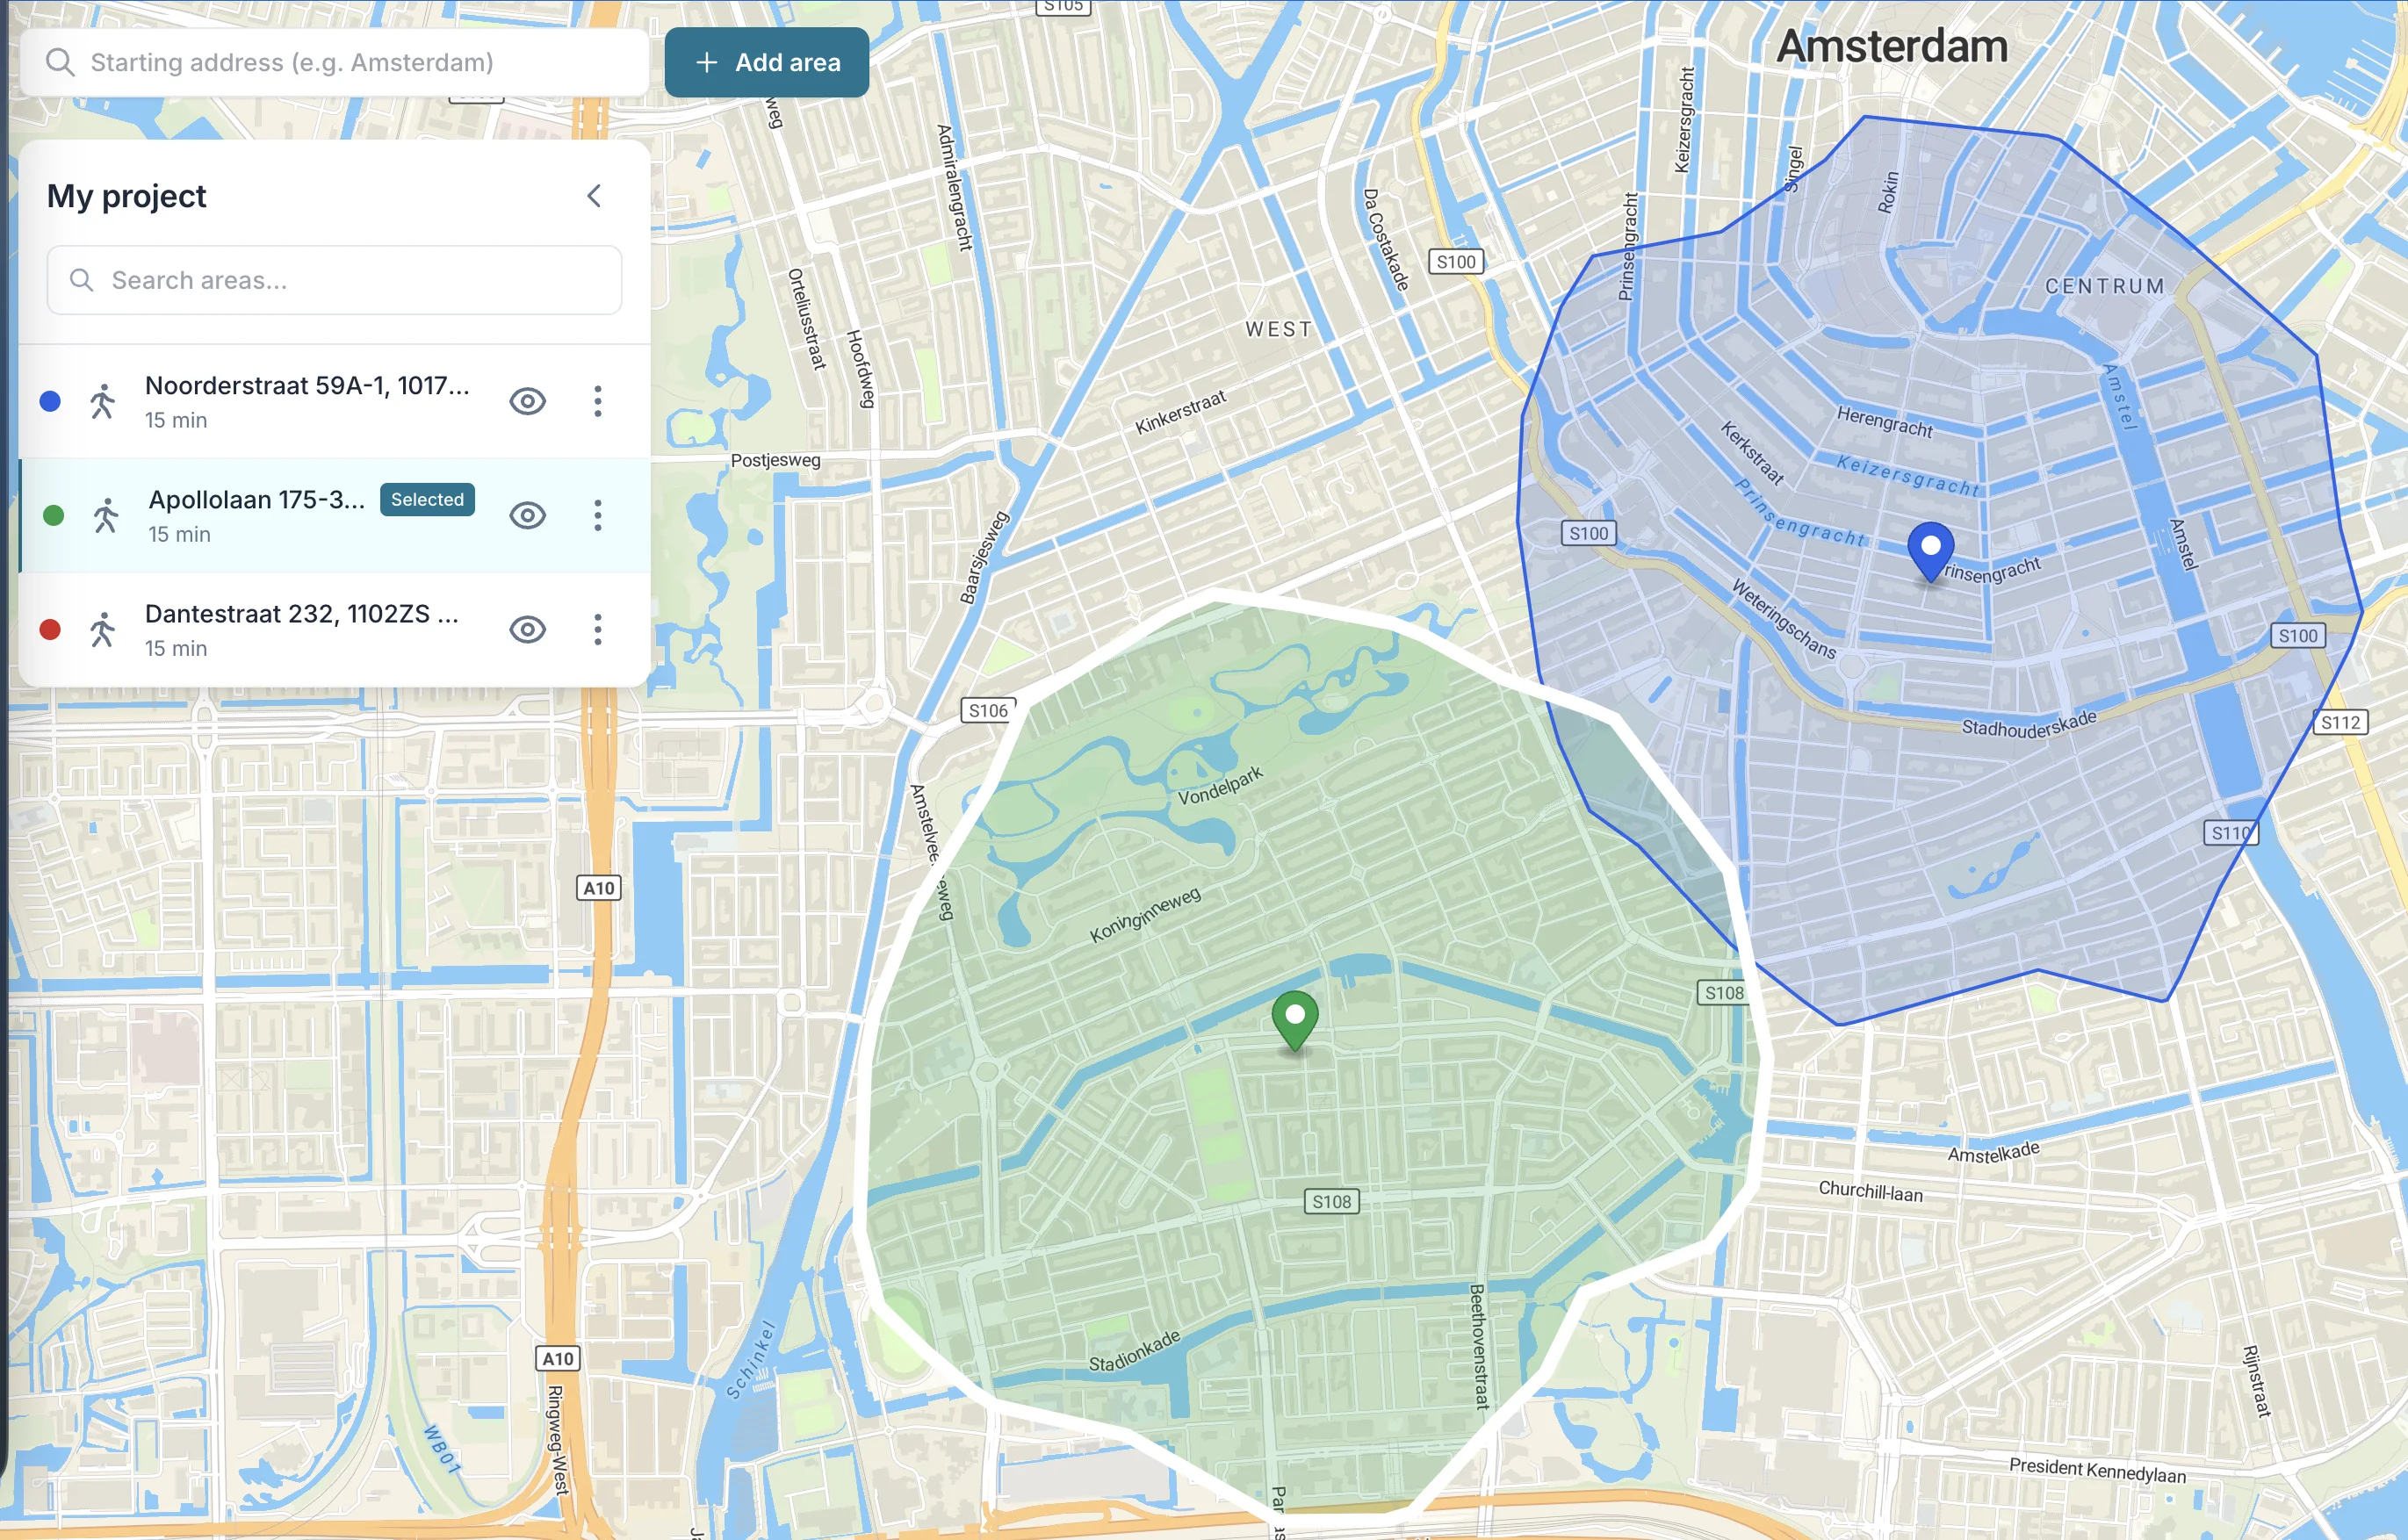
Define your area of interest with precision using our interactive map tools. Start by entering any address in the Netherlands, then choose how you want to define your analysis zone.
Radius zones let you draw a circular zone around any point — choose from predefined distances (250m, 500m, 1km, 3km, 5km) or set a custom radius for quick catchment area analysis.
Isochrone zones go further by defining areas based on actual travel time rather than distance: set up a 5-minute walking zone or a 10-minute driving zone that accounts for road networks, one-way streets, and walking paths.
You can also add multiple zones per project to compare different sites side by side, or layer zones of different sizes on the same location to see how demographics change as you expand the catchment area.
Demographics
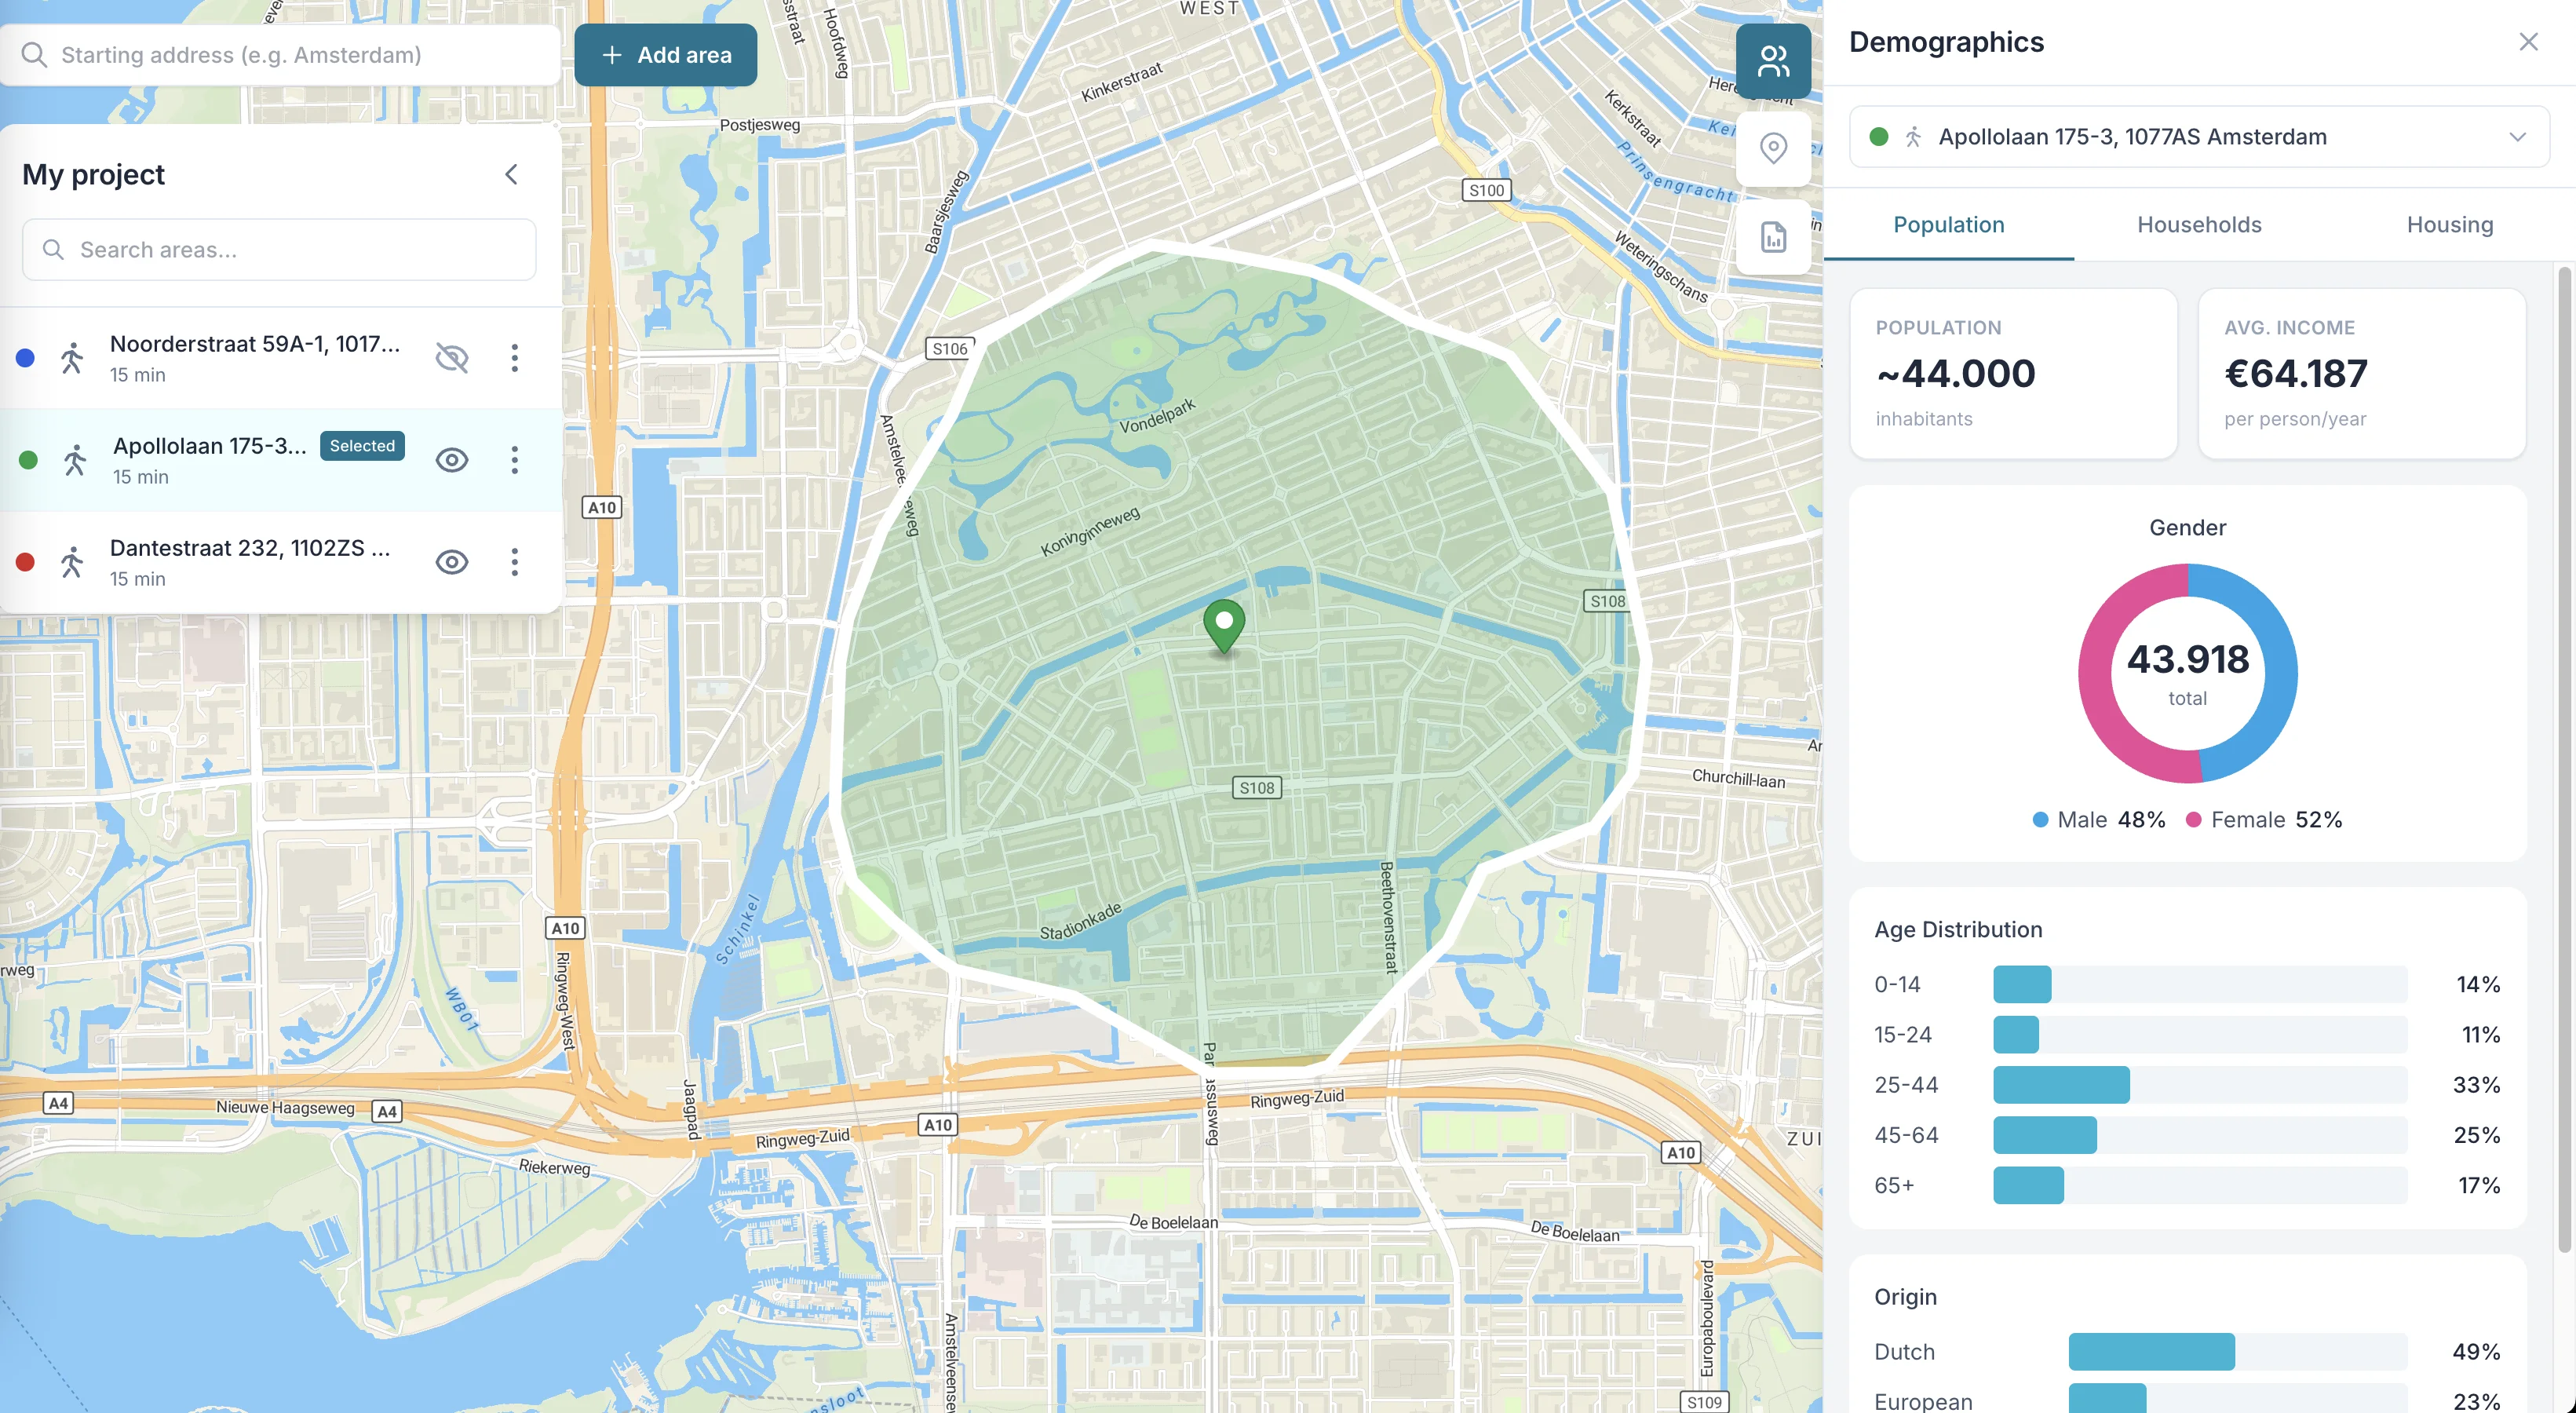
Get comprehensive demographic data for any zone you draw. All data comes from official Dutch government sources (CBS) and is updated yearly.
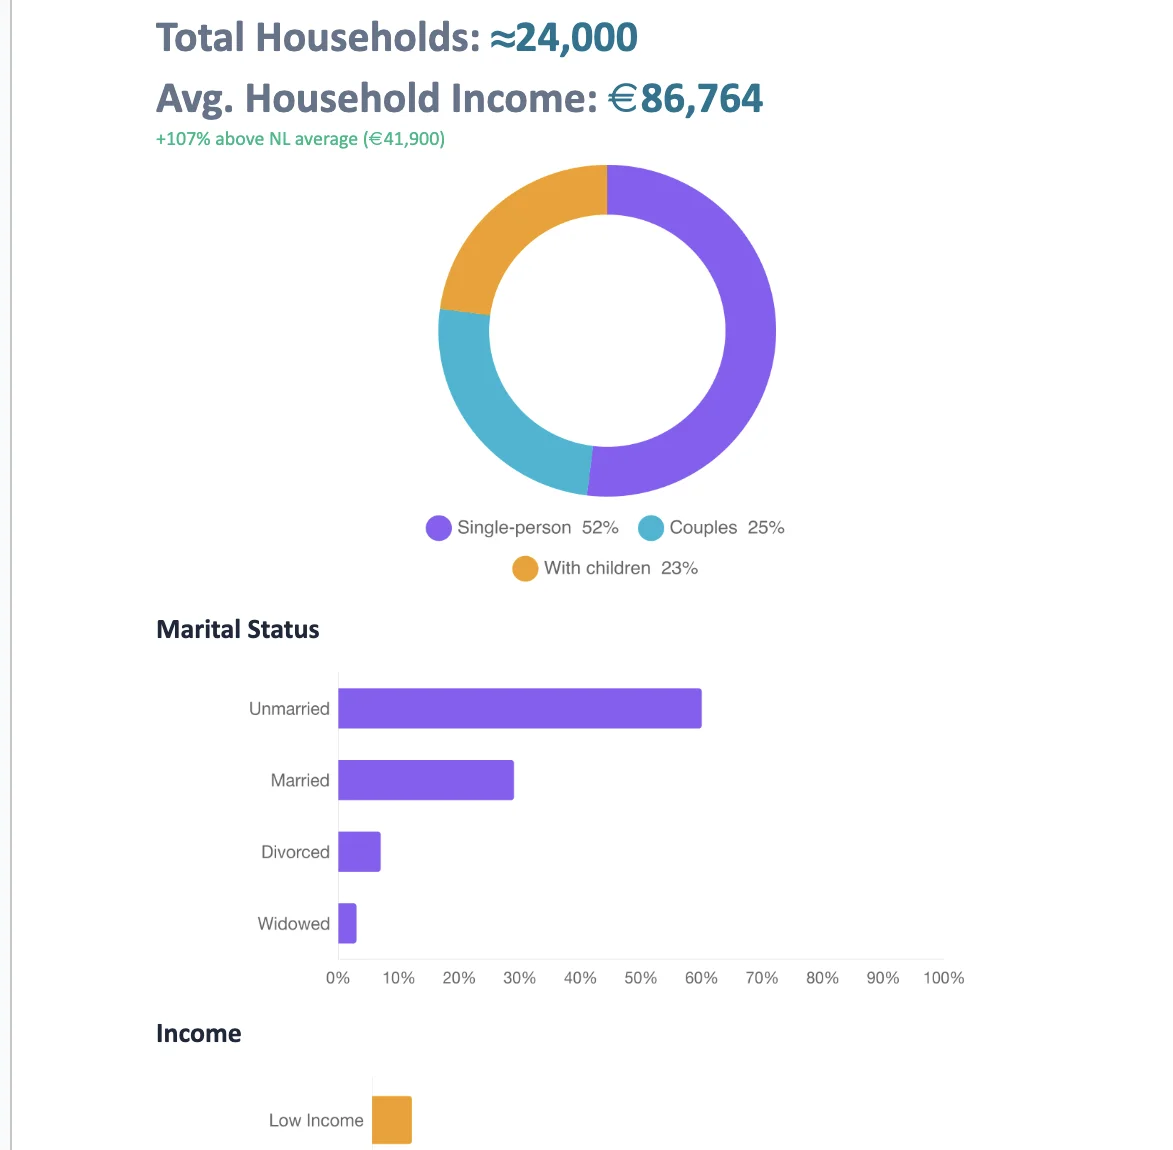
Population & households — total population count, number of households, average household size, and population density within your zone. Understand the scale of the market opportunity at a glance.
Age distribution — detailed age breakdowns help you understand whether a location serves young professionals, families with children, or retirees. Essential for retailers and franchisors targeting specific age groups.
Income & wealth — average household income and purchasing power data per zone. Know whether the local population matches your target customer profile before signing a lease.
Housing — property values (WOZ), construction periods, dwelling types, and ownership ratios. Valuable context for CRE brokers and anyone assessing neighborhood quality and stability.
Competitor Mapping
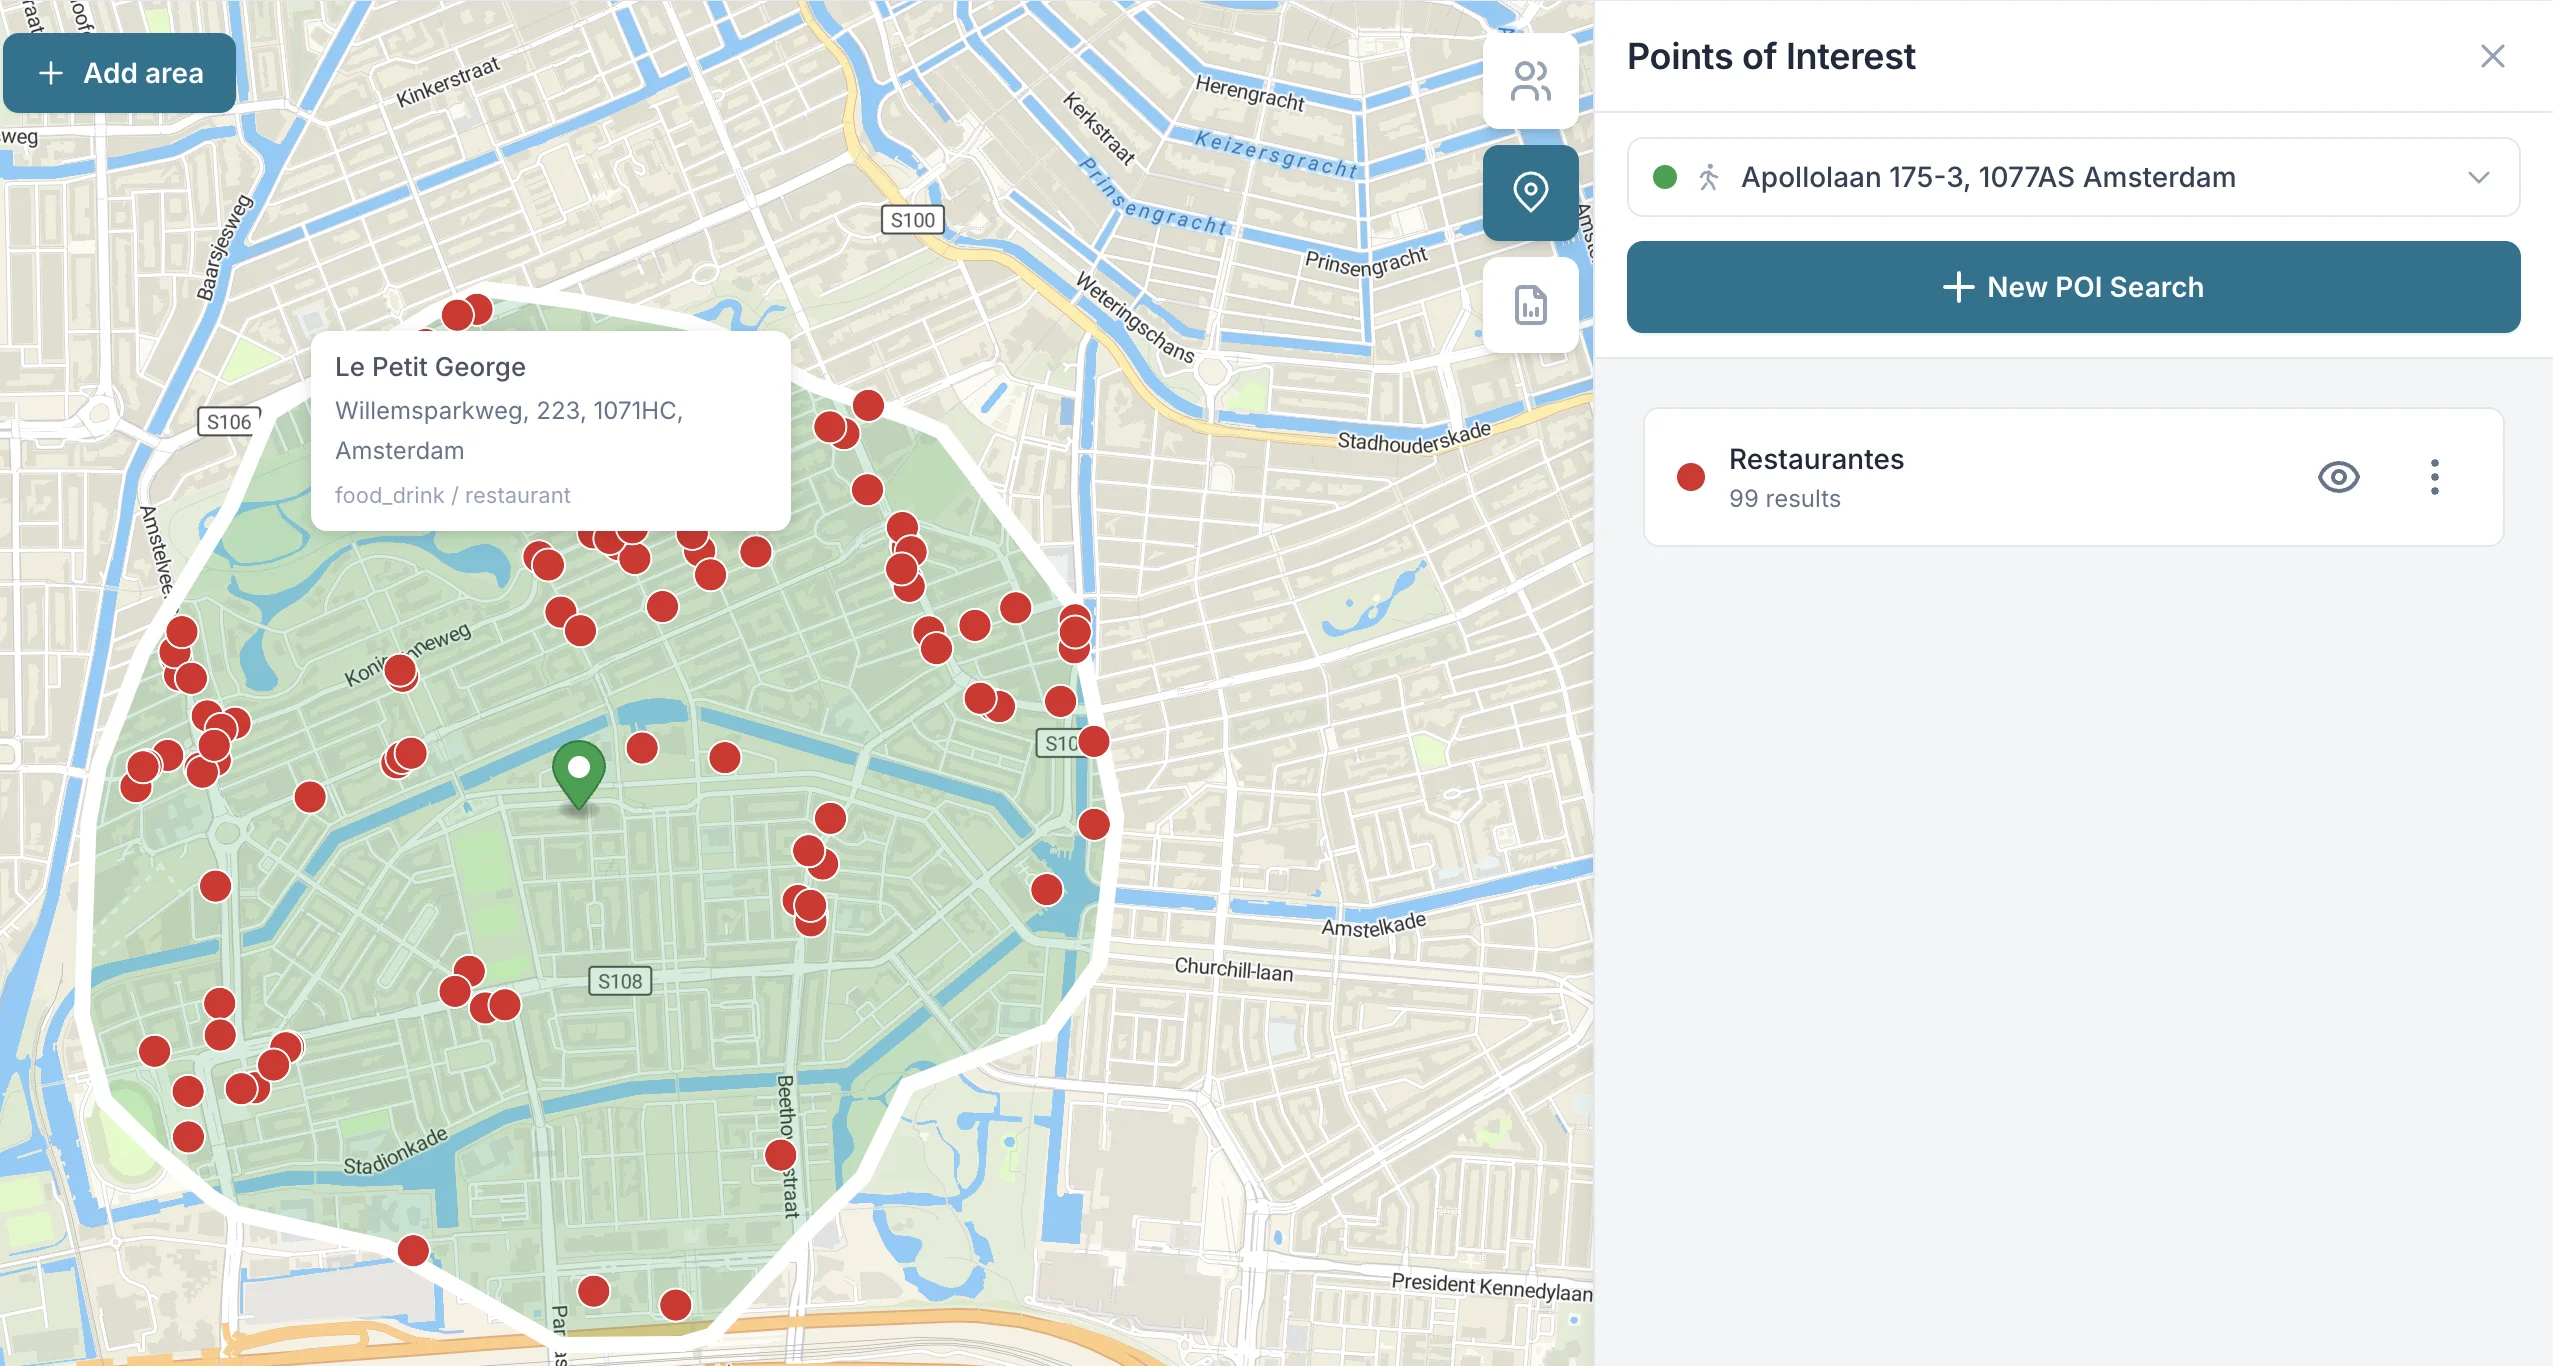
Identify competitors, complementary businesses, and points of interest within any zone. Powered by OpenStreetMap data with over 700 categorized business types.
Search by category — find all supermarkets, restaurants, gyms, pharmacies, or any other business type within your zone. Our category system uses the official OpenStreetMap taxonomy with Dutch and English search support.
Search by brand — looking for all Albert Heijn locations in an area? Or want to see how many Jumbo stores compete in a catchment area? Search by specific brand names to map exact competitor locations.
Visual mapping — all competitors appear as pins on the map, making it easy to spot clusters, gaps, and patterns. See at a glance whether a location is oversaturated or underserved for your business type.
Location Reports
Generate professional PDF reports for any zone. Share findings with clients, attach to proposals, or use for internal decision-making. Each report includes all demographic data, competitor overview, and zone visualization on the map.
Reports are designed to be presentation-ready — CRE brokers can send them directly to clients, and franchise managers can include them in location evaluation packages.